


What are pivot points?
A pivot point is a technical indicator used by traders in forex and other markets to identify potential turning points in trading trends. Pivot points can help traders identify probable levels of support and resistance, and therefore whether a currency is likely to move higher or lower. They can thus be used as profit targets, to set stop losses, and as a guide to setting entry and exit orders.
How to calculate pivot points?
Pivot points are calculated using mathematical formulas to establish intraday, daily, weekly, monthly or quarterly ranges.
The five-point system is the traditional method and the most widely employed. It uses the previous high, low and close, as well as two extra support levels and two additional resistance levels, to provide five pivot points. These points are calculated in the following way:
- Pivot point (P) = (previous high + previous low + previous close) / 3
- Support 1 (S1) = (pivot point x 2) – previous high
- Support 2 (S2) = pivot point – (previous high – previous low)
- Resistance 1 (R1) = (pivot point x 2) – previous low
- Resistance 2 (R2) = pivot point + (previous high – previous low)
There are other ways of calculating pivot points, but the above is the standard method. Pivot points can be added to a chart on a broker platform such as IG Markets by selecting the indicator dropdown menu and choosing ‘pivot points’ or by right-clicking to select them. Instead of using daily pivot points, a trader can use weekly data, useful for longer-term trading.
Trading strategies using pivot points
When a price rises through a pivot point, this indicates an uptrend, while a downtrend is indicated when a price falls through a pivot point.
According to the broker AvaTrade, the trend lines can provide traders with trade entry and exit points. It adds that “pivot points are pretty accurate and relevant because they use previous period price action to forecast probable current price behaviour”
However, the system is not completely reliable. During some sessions, the movements will prove excellent indicators of overall trends. But in other sessions, there may be little if any correlation.
You should always use a stop loss when trading pivot point breakouts. A good place for your stop would be a top/bottom which is located somewhere before the breakout. This way your trade will always be secured against unexpected price moves. You should hold your pivot point breakout trade at least until the price action reaches the next pivot level.
Candlestick pivot-point strategy
Pivot points can be used with any type of chart, but they are most useful when applied to candlestick charts. These are among the most popular charts used by day traders to identify patterns.
The example below from IG Markets shows an hourly chart of the AUD/USD pair. The price has moved above the central pivot point but has then fallen back and closed below it, suggesting that a further downward movement is likely.
Figure 1: Pivot points suggest price is likely to fall further
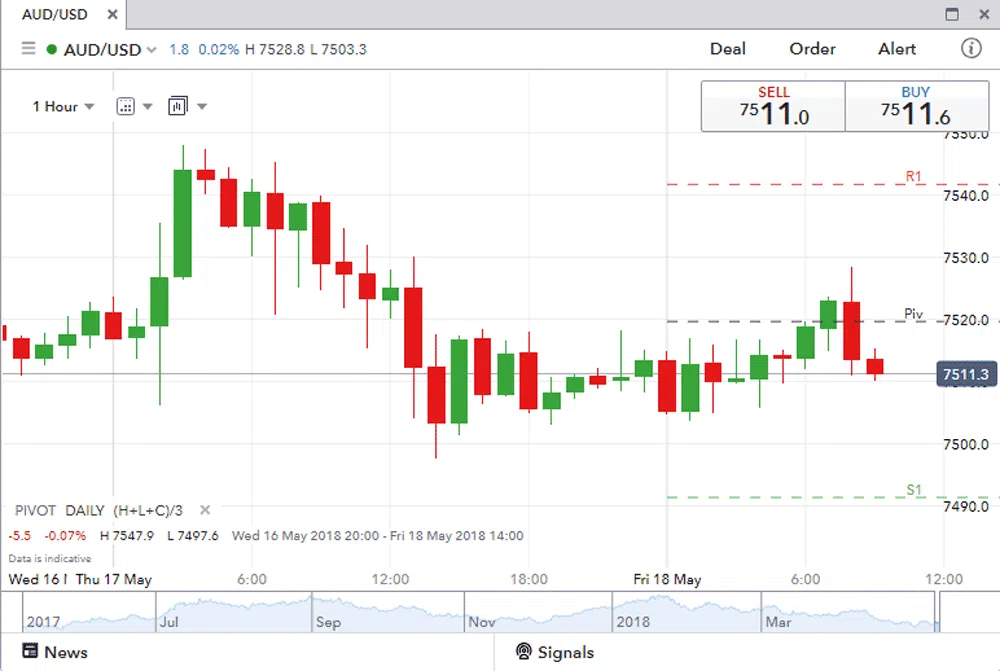
Source: IG Markets
In another example, the price on this hourly USD/CAD pair has bounced from near the daily pivot, suggesting that it could move higher and challenge the R1 resistance point.
Figure 2: Pivot points suggest price is on an uptrend
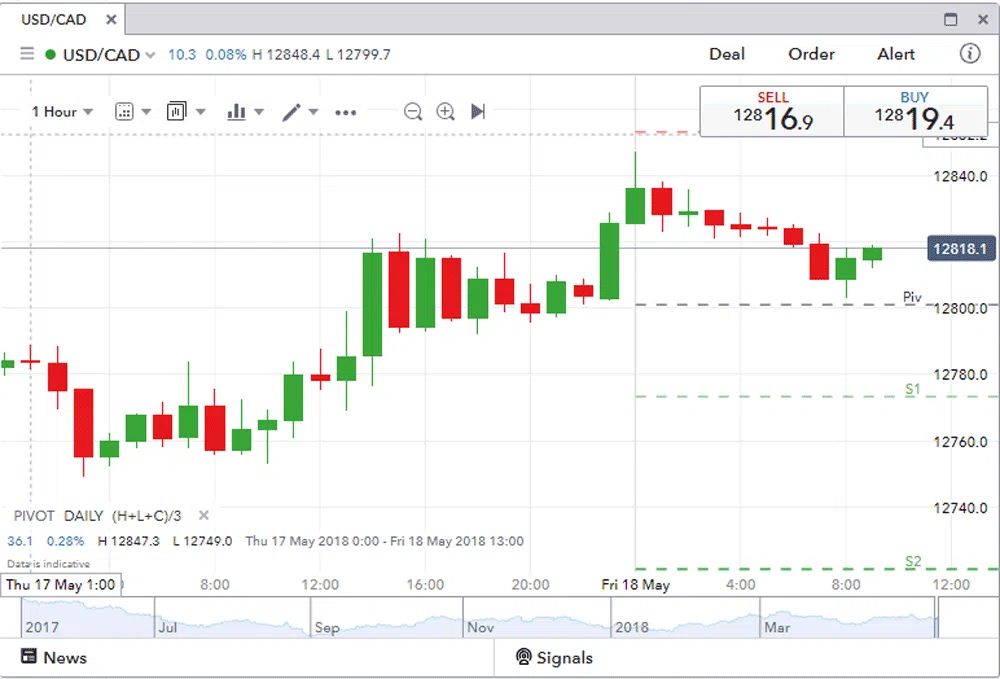
Source: IG Markets
Support and resistance pivot-point strategy
The use of the S1, S2, R1 and R2 pivot points can help a trader to gauge entries more effectively. Rather than chasing a rally or pursuing a falling market, “a dip to the support level at S1 and then a rally to R1 provides a more effective way of trading than trying to buy when the price has hit R1”.
It always makes sense to find the trend and go with it, so in a broader uptrend a trader will wait for pullbacks to S1 or S2, and in downtrends, they will aim to sell at retracements towards R1 or R2.
The pivot-point bounce strategy
This strategy directs the trader when to buy and sell. It is very simple. The pivot points serve as support and resistance areas from which a currency pair will bounce off, i.e., trending higher or lower. They will represent an area in the market where the prevailing market sentiment will change direction. So, when a price is moving higher it may find a level of resistance from which prices cannot move any higher but are likely to move lower. Meanwhile, when prices are falling, they will find support at a certain level from which prices cannot move lower and bounce higher.
The Indian stockbroker Nirmal Bang argues that in terms of timing:
“In the pivot point bounce strategy, it is advisable to buy the stocks (or currency pair in this case) when there is an upward bounce on the upward side. While, if the reverse happens, there is a downward bounce, it is time to sell the stocks (or currency pair in this case). One of the key points to note is setting the right position of the stop-loss order to reduce the losses.”
This strategy is ideal for ranging markets, but it can also be used for trading trending markets during retracements. In a ranging market, traders can simply sell (go short) at resistance and buy (go long) at support. For instance, if the market is contained between R1 and S1, buy orders will be placed around S1, with sell orders placed around R1.
In a trending market, relevant Pivot Points will act as reference points for retracing markets to resume the main trend. For instance, if the prices are above PP during an uptrend but below R2. Traders can look to place lucrative buy orders around R1.
The pivot-point breakout strategy
In this strategy, a trader opens a position using a stop-limit order when the price breaks through a pivot point level. If the breakout is bearish, then you should initiate a short trade. If the breakout is bullish, then the trade should be long.
We illustrate exactly how a breakout strategy works by using the chart below.
Figure 3: Fifteen-minute chart of EUR/USD.
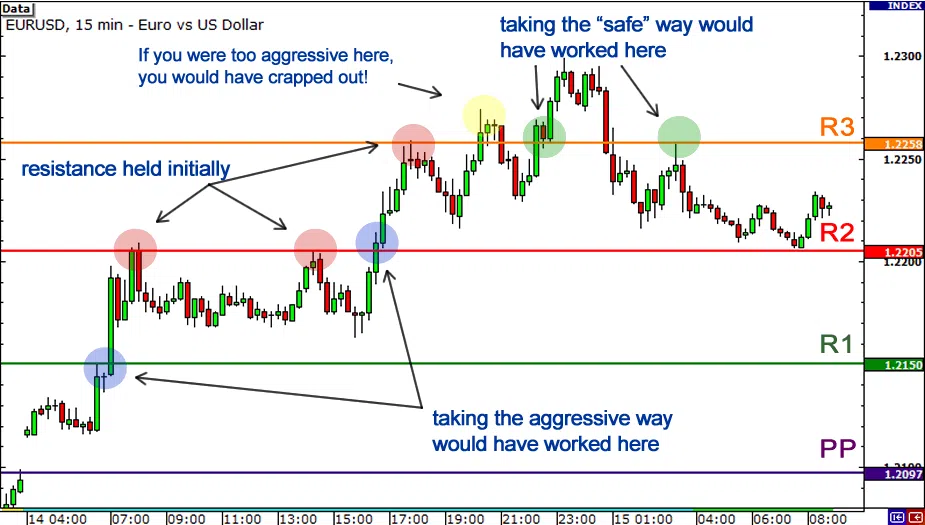
Source: Babypips.com
The chart shows the EUR/USD pair making a strong rally over a trading day. It opened by gapping higher above the pivot point, before pausing at R1, the first resistance level. However, it then broke through R1, climbing by over 50 pips. An aggressive trader would have caught the initial move and would have been overjoyed.
Meanwhile, a cautious trader would have waited for a retest and would have been disappointed that the price did not retest after breaking R1. They would have been particularly disappointed that the same thing happened again at R2.
However, the aggressive trader could have later been caught out as the price failed to sustain the initial break. If the aggressive trader’s stop-loss was too tight, they would have gotten stopped out.
Later in the day, the pair reversed and broke down past R3, providing an opportunity to take a short on the retest of resistance-turned-support-turned resistance.
It can be difficult to pick a spot to place your stop when undertaking a breakout strategy. The key is to remember that you should look for strong fast moves. Once a level is broken that level will usually become support-turned-resistance or resistance-turned-support. This is called a role reversal. So, if you were going long in the example in figure 3 and the price broke R1, you could place your stop just below R1.
Meanwhile, in terms of setting targets, it would be best to aim for the next pivot point support or resistance level to take profits. It’s very rare that price will break past all the pivot point levels unless an unexpected economic or geopolitical event occurs.
The pivot-point swing-trading strategy
This strategy is favoured by traders who prefer medium- to longer-term trades. If you think of the traders as being like surfers, the aim is to catch and ride big, long waves. The trader should first identify major pivots in the market. Identifying pivot points is fairly simple as we have seen. The chart below shows major and minor pivot points. It is clear that major pivot points are easier to spot and tend to form near support and resistance levels or they themselves create a new important level. At these points, buyers and sellers are very active. By contrast, minor pivots form more regularly and randomly.
Figure 4: Major and minor pivot points
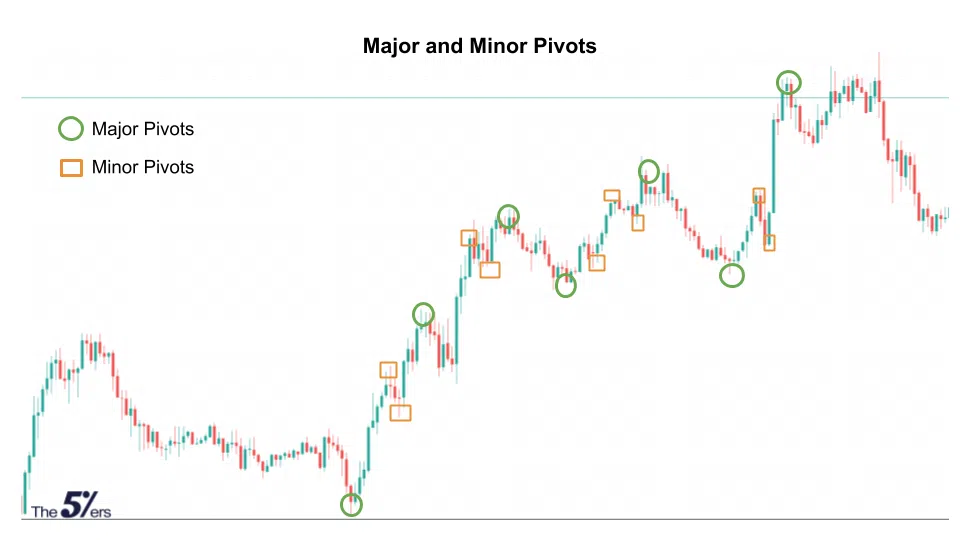
Source: the5ers.com
Pivot points have been added to the weekly chart of the USD/ZAR pair below. The chart shows that there has been a trend reversal to the upside, which is evident after the price breaks through the previous pivot resistance. Forex traders can now place long entry orders at the pivot price, which acts as a support level.
Figure 5: USD/ZAR weekly chart
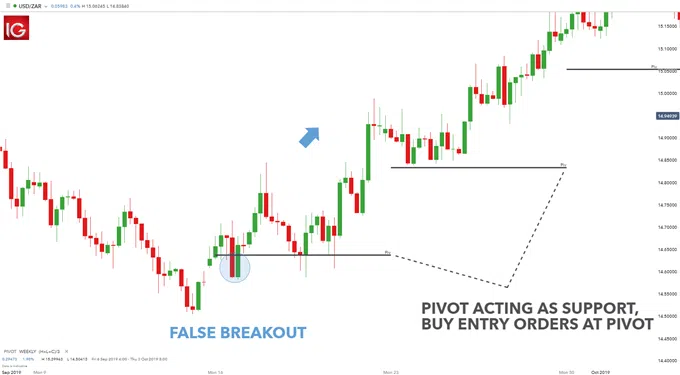
Source: dailyfx.com
The chart shows there is a false breakout (blue circle) but there is then substantial upside that could be exploited. Pivot levels do not always contain the price, but they do offer a price level to maintain the directional bias, this lengthier time horizon is ideal for swing traders.
Pros and cons of candlestick pivot points
Advantages
- Candlestick pivot points are simple to understand and use.
- They can be used over different time frames.
- They strengthen a trader’s risk management.
Disadvantages
- Pivot points don’t always work in predicting price trends.
What is the Camarilla pivot-point strategy?
This is an extension of the classic five-point strategy. It consists of four support and four resistance levels that are located closer together than other pivot-point types. Consequently, the Camarilla pivot is most suitable for short-term trading.
Figure 6: Camarilla pivots are much closer together than those used in the five-point strategy
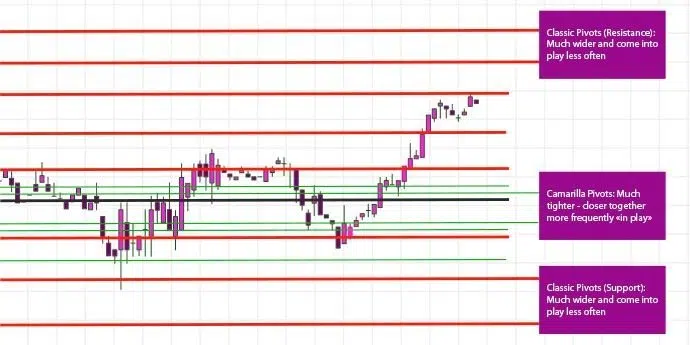
Source: mtrading.com
As with the five-point system, Camarilla uses the previous day’s high price, low price and closing price. These pivot points work for all traders and help in setting the right stop-loss orders and profit targets.
The calculation of the Camarilla pivot points, with resistance and support levels, is detailed below:
- Resistance 4 (R4) = Closing + ((High – Low) x 1.5000)
- Resistance 3 (R3) = Closing + ((High – Low) x 1.2500)
- Resistance 2 (R2) = Closing + ((High – Low) x 1.1666)
- Resistance 1 (R1) = Closing + ((High – Low x 1.0833)
- Pivot point (PP) = (High + Low +Closing) / 3
- Support 1 (S1) = Closing – ((High – Low) x 1.0833)
- Support 2 (S2) = Closing – ((High – Low) x 1.1666)
- Support 3 (S3) = Closing – ((High – Low) x 1.2500)
- Support 4 (S4) = Closing – ((High- Low) x 1.5000)
Camarilla pivot-point trading strategies
Below we detail the two most popular Camarilla strategies.
Camarilla range strategy
A range is where the price trades between the lines of resistance and support. Camarilla points are sometimes used by range traders because this indicator presents a new range to trade each day.
According to the broker Admirals, traders who are interested in short-term reversals can focus on the price changing between the R3 and S3 pivots. Traders consider this region the daily range, which can be used for a good pivot-point strategy for day trading. It creates an area that traders can use to decide when to enter the market.
Range-reversal traders are looking for the price to move either towards a point of resistance or towards a point of support. When the resistance keeps the price from moving higher, a range trader may consider starting a short position near the R3 pivot, anticipating that the price will move towards the support.
The most important levels are S3, S4 and R3, R4.
If the price remains around the S3 support, a range trader may consider initiating a buy position near that S3 pivot support, with the anticipation that the price may move up towards the R3 resistance.
However, it’s important to note that the price can simply remain within a range all day. The strategy is best suited for periods of low volatility, such as during the Asian session. During more volatile times, traders may be better off abandoning this strategy for something suited to volatile price movements, or a trend strategy.
Camarilla trend strategy
A trend is a steady price movement that continues either higher or lower for a specific period of time. The Camarilla pivot-point trading strategy can be very useful in trending markets and can suggest to traders, key levels for entry, stop and limit.
If the market is on an upward trend, traders usually look for an opportunity to buy at the S3, with a stop set at the S4. By contrast, adds the broker, if the market is in a downtrend, traders might sell at the R3 and set a stop at the R4.
Different traders use different methods to determine where they will set their take-profit levels. These methods include:
- Fibonacci* extensions/retracements: a Fibonacci pivot-point trading strategy may involve waiting for the Fibonacci retracement line to converge with a pivot support line (S1, S2, S3) to enter a long position in an upward trend.
* Fibonacci numbers and lines are technical tools for traders based on a mathematical sequence developed by an Italian mathematician. - Price action: When the price action approaches a pivot point on a chart, a trader needs to decide whether this situation is a normal trading level. If the price begins hesitating once it reaches this level and then bounces in the opposite direction, this may be a sign to trade in the direction of the bounce. However, if the price action moves past the pivot, a trader may decide that a breakout is underway.
Pros and cons of Camarilla pivot points
Advantages
- Camarilla pivot points are good for short-term traders.
- They strengthen a trader’s risk management.
- They are suitable for all financial markets.
Disadvantages
- Camarilla pivot points are not always helpful for longer-term traders.
- They can be difficult for new traders to use.
- Applying the strategy to unfavourable market conditions can result in additional losses.
Overall pros and cons of using pivot points
Advantages
- They are ideal for day traders since the pivot points rely on data from the previous trading day and apply it to the current trading day. Consequently, pivot points are unique in that the levels you are looking at are applicable only to the current trading day.
- Pivot points provide a wealth of data, giving between five to seven separate trading levels, plenty enough for a day trader.
- Pivot points are easy to use and most trading platforms provide this type of indicator with the separate levels already calculated. You simply have to follow the trading strategies outlined in this and other articles on the subject.
Disadvantages
- Since pivot points data is taken from just a single day´s trading pivot point strategies can only be applied to shorter time frames such as 1-minute, 2-minute, 5-minute, and 15-minute.
- Pivot points are not completely reliable. There are times when pivot points are very good at predicting price movements, there are also times when the levels appear to offer not guide at all to trends in the market. As with all technical tool, it is best not to rely on one indicator exclusively.
Conclusion
Pivot points can help a trader determine trends in price movements, but there is no guarantee that the strategy will work all the time. So, it is best to always use a stop-loss order strategy and to know where to position the stop-loss limit.