


These are the analysis tools that every Forex trader needs to know how to use to be successful in their trading. Forex analysis tools will help you make more informed trading decisions, which will ultimately improve your performance as a trader.
Today’s market participants have a huge selection of trading tools at their disposal and there are four main categories:
- Trend Analysis
- Market Analysis
- Technical Analysis
- Sentiment Analysis
Trend Analysis Tools
Before deciding to buy or to sell a currency pair you need to assess the current market trend and momentum. There are several tools that can help assess the predominant trend, but the simplest measures is the moving average which will give you the historical trend of a pair. The majority of trading platforms come with built-in technical indicators, and this is often one of them.
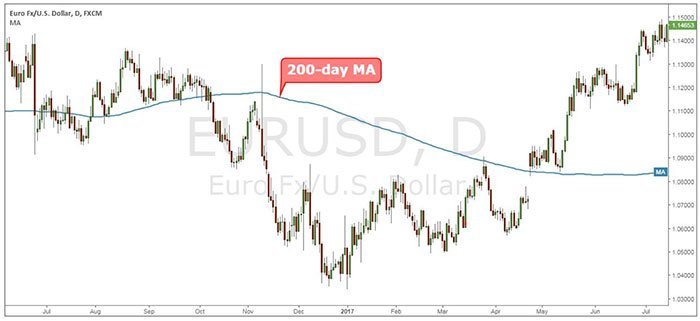
Moving average example
Market Analysis Tools
Forex market analysis tools are generally standalone and assist traders with various calculations and market analysis.
Forex Pair Correlation Tools
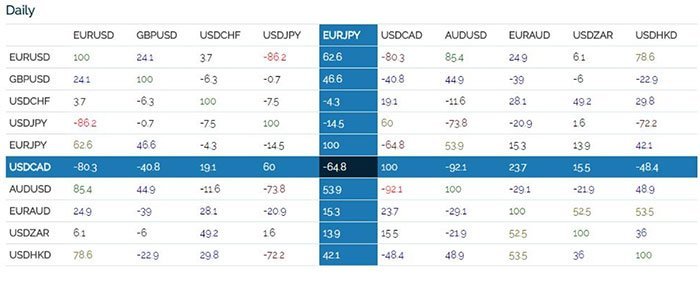
Forex Pair Correlation
This tool measures the correlation between two or more currency pairs. It will show if the movement of a currency pair is moving in a similar pattern to other pairs, which is helpful for traders as trading correlated pairs can lead to lower profits.
Carry Trade Calculator
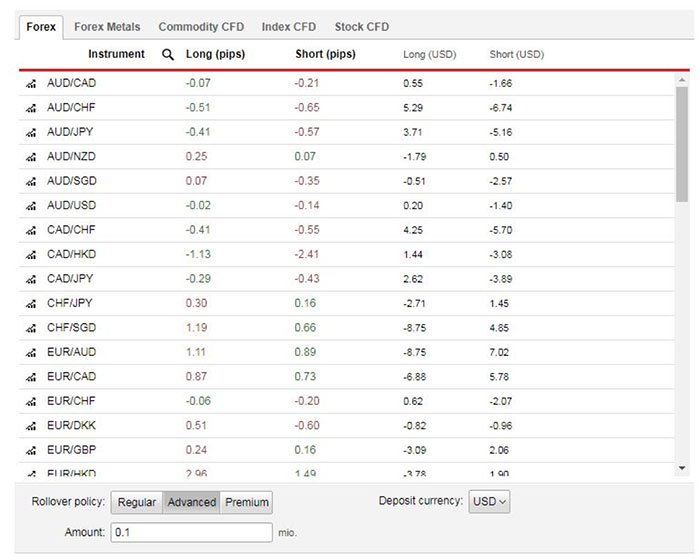
Carry Trade Calculator
A Carry trade calculator predicts the interest that you will either be paid, or you must pay when holding a trade overnight. These payments will affect your account balance.
Forex Volatility Calculator
The Forex Volatility Calculator predicts how much a currency is going to move, on average, over any given period. It is calculated by taking the average of the difference between the highest and the lowest price for any time frame. This tool is very useful for determining which currency is most volatile and can give a trader an idea of where stop-loss and take-profit should be placed.
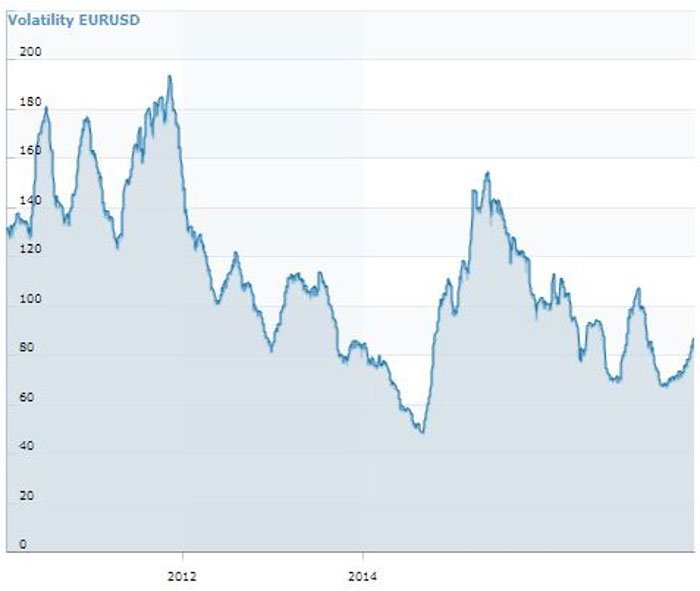
Forex Volatility Calculator
Pivot Point Calculator
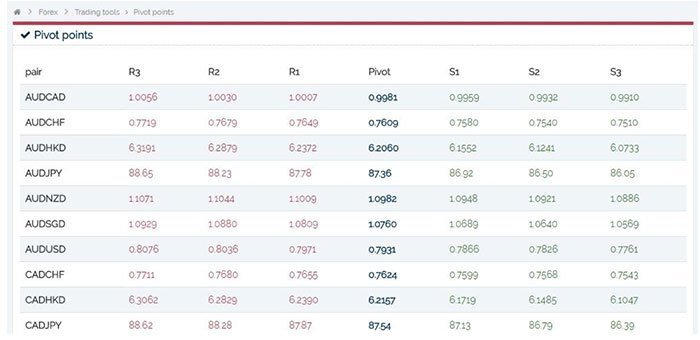
Pivot Point Calculator
A Pivot Point Calculator is used to calculate pivot points in any trading market, where a market’s trending direction pivots and momentum continues in the opposite direction.
Position Sizing Calculator
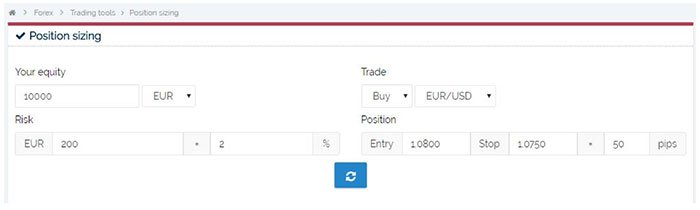
Position Sizing Calculator
Use a position size calculator to help you quickly calculate the size of your position as having a trading plan and risk management strategy is central to maintaining a healthy portfolio.
Pip Value Calculator
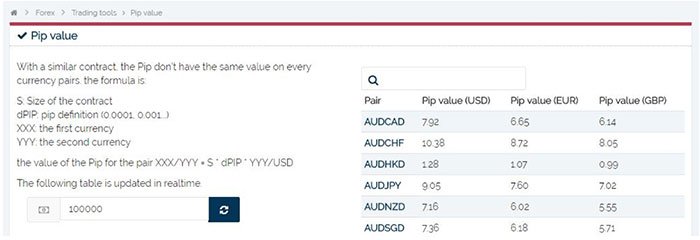
Pip Value Calculator
Pip value varies from one currency to another, so this calculator will help a trader decide how much each pip is worth.
Technical Analysis Tools
Most trading platforms include technical indicators that can be placed on a price chart. They can be broken up into three groups:
- Lagging indicators (Example: Moving Averages)
- Leading indicators (Example: Stochastic and MACD)
- Confirming indicators (Example: On Balance Volume)
RSI indicator
The RSI indicator (Relative Strength Index) is a popular technical tool used to detect overbought and oversold pairs. It is a good indicator of the overall momentum in the market.
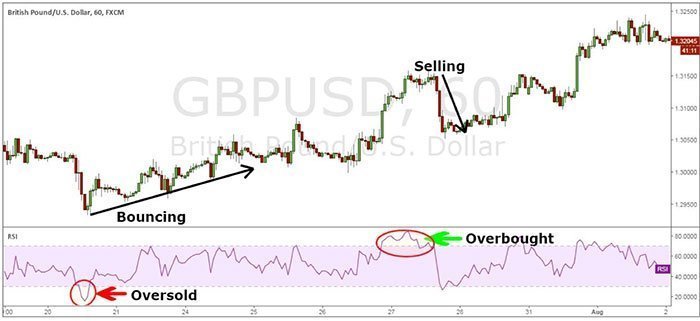
RSI Indicator
MACD Indicator
The MACD (moving average convergence divergence) is one of the most used momentum indicators as the mechanics behind it are quite simple. If the histogram shows a reading above zero, we have bullish momentum and below zero we have bearish momentum. Traders use this indicator to gauge the overall strength of the market.
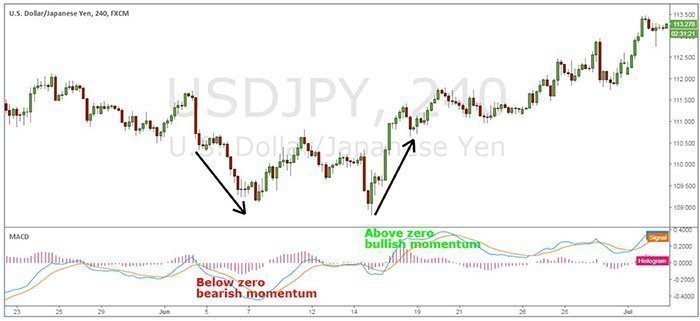
MACD (moving average convergence divergence)
Bollinger Bands
Bollinger Bands are a technical indicator that is overlaid on price and can be helpful in determining where to take profit, but also where to hide a stop-loss order.
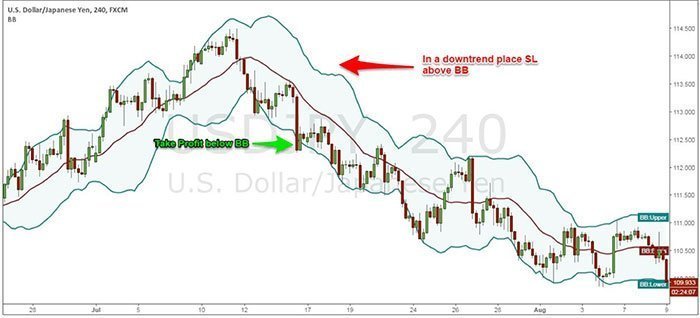
Bollinger Bands
TradingView
TradingView is a tool that CFD traders can use to research, chart and screen stocks, forex, cryptocurrencies, indices, futures and bonds. It offers news feeds, a social networking capability that allows you to interact with other traders, and the ability to create both simple and complex charts. Subscription choices range from a free basic account that will allow you to explore the platform and practise trading to paid subscriptions for more advanced traders. These are the best brokers who offer TradingView free of charge to their clients.
Trading Central
Trading Central, established in 1999, offers a variety of tools to help independent traders in CFDs and other financial instruments “make informed and timely investment decisions”. The company focuses on the following areas:
- Fundamental analysis
- Technical analysis
- Automated analysis
- News and market sentiment
- Economic analysis
- Expert research.
Trading Central does not sell its services directly to investors, but to the online brokers through which they trade. Consequently, traders can only use Trading Central’s tools if they are registered with an online broker that cooperates with the company. These are the best brokers who offer Trading Central free of charge to their clients.
Autochartist
Autochartist is a technical-analysis trading tool that uses financial data to provide traders with signals that help them trade. Integrated into the MetaTrader 4, MetaTrader 5 and cTrader platforms, the service is widely available via web, mobile and desktop applications for both Windows and Mac. As with Trading Central, you cannot access Autochartist’s services directly but instead, need to sign up with a broker that partners with the company. It is sometimes possible to try out Autochartist’s services for free via a broker’s demo account. These are the best brokers who offer Autochartist free of charge to their clients.
Sentiment Analysis Tools
Sentiment analysis tools measure the positions of other traders in the market.
Most retail FX brokers will provide you with a short summary of open positions held by their clients. Since 70-95% of traders lose money, this can be invaluable to show overcrowded trends. When a majority of traders are in agreement about the current trend, this could be an opportunity to open a position in the opposite direction.
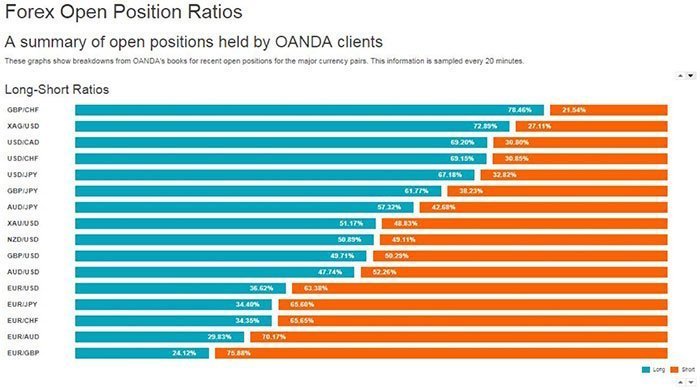
Client Open Positions
Another great source of sentiment analysis can be obtained from the COT report, which contains information about where the big players are placing their money.